光响应曲线模型有很多,主要分为四大类,直角双曲线,非直角双曲线,指数以及直角双曲线修正模型,我们分别从直角双曲线模型开始介绍。
Baly (1935 ) 提出了直角双曲线模型,它的表达式为:
P_{n} = \frac{\alpha I\ P_{nmax}}{\alpha I + P_{nmax}}- R_{d}
\tag{8.1}
其中,P_{n} 为净光合速率;
I 为光强;
\alpha 为光响应曲线在光强为 0 时的斜率,即光响应曲线的初始斜率,也称之为初始量子效率;
P_{nmax} 为最大净光合速率;
R_{d} :为暗呼吸速率。
对 公式 8.1 求导可知其导数大于 0,也就是直角双曲线是一个没有极值的渐近线,因此,无法 由 公式 8.1 求得饱和光强。
因此就需要使用弱光条件下 (\leq 200 \mu mol\cdot m^{-2}\cdot s^{-1} ) 的数据得到表观量子效率(apparent quantum efficiency,AQE),利用非线性最小二乘法估算 P_{nmax} ,然后利用 ZiPiao (2010 ) 的式 公式 8.2 求解 I_{sat} ,
P_{nmax}= AQE \times I_{sat} - R_{d}
\tag{8.2}
但此方法测得的光饱和点远小于实测值,我们人为光强达到最大光合速率的一定比例时值计算光强,人为此时的光强为饱和光强,例如 0.7P_{nmax} Zhang, Shen, 和 Song (2009 ) 、0.9P_{nmax} Huang 等 (2009 ) 、或其他设定的值来的来估算 I_{sat} 。
直角双曲线模型的实现
若没有安装 minpack.lm, 则需要首先:
具体实现过程如下:
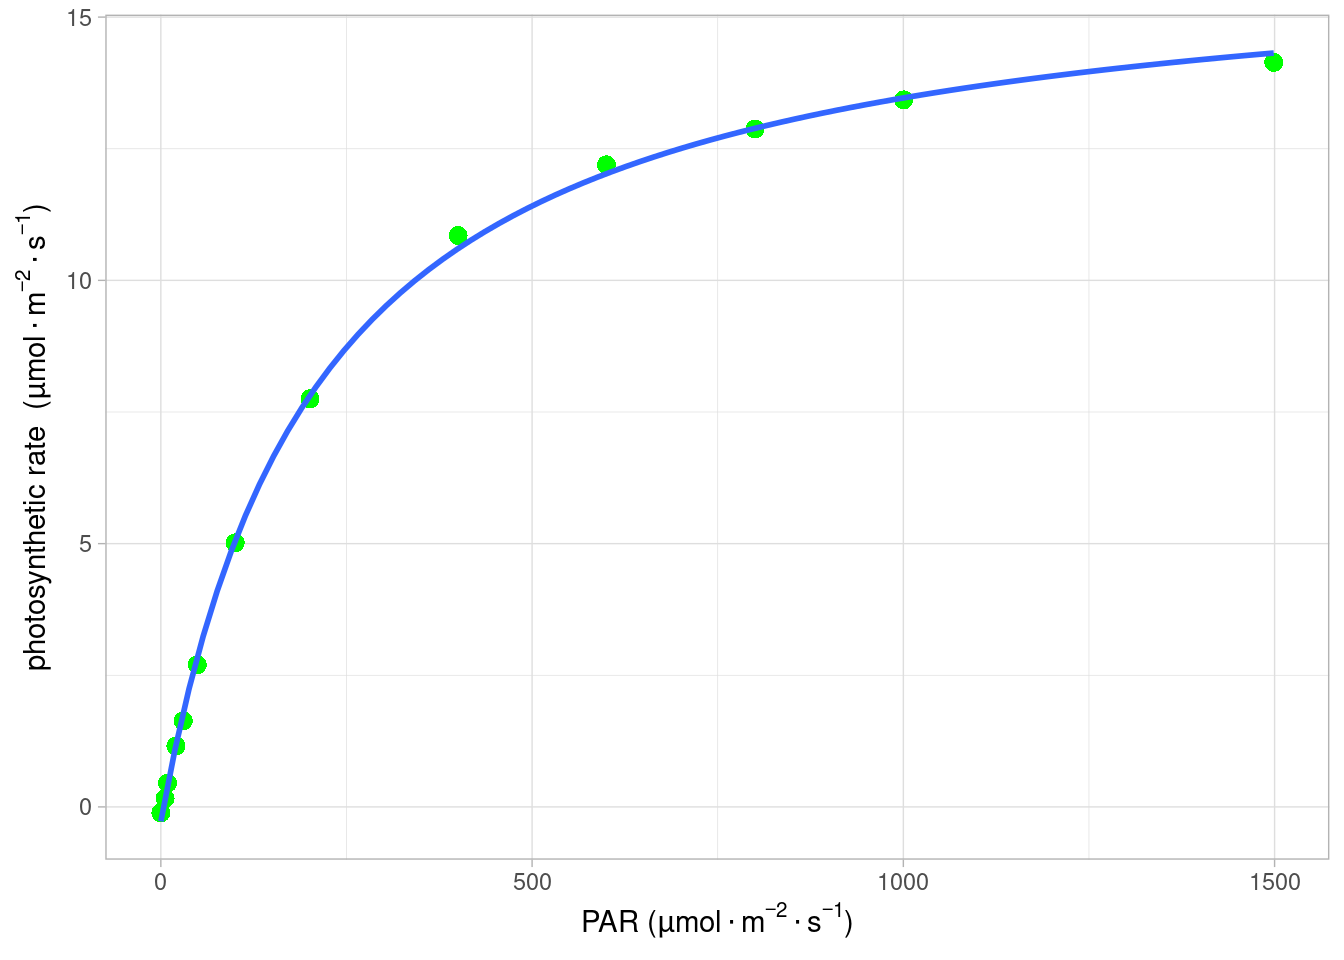
Code # 调用非线性拟合包minpack.lm,也可以直接使用nls library ( minpack.lm ) # 读取数据,同fitaci数据格式 lrc <- read.csv ( "data/lrc.csv" ) lrc <- subset ( lrc , Obs > 0 ) # 光响应曲线没有太多参数, # 直接调出相应的光强和光合速率 # 方便后面调用 lrc_Q <- lrc $ PARi lrc_A <- lrc $ Photo # 采用非线性拟合进行数据的拟合 lrcnls <- nlsLM ( lrc_A ~ ( alpha * lrc_Q * Am ) * ( 1 / ( alpha * lrc_Q + Am ) ) - Rd ,
start= list ( Am= ( max ( lrc_A ) - min ( lrc_A ) ) ,
alpha= 0.05 ,Rd= - min ( lrc_A ) )
) fitlrc_rec <- summary ( lrcnls ) # 补偿点时净光合速率为0, # 据此利用uniroot求解方程的根 Ic <- function ( Ic ) { ( fitlrc_rec $ coef [ 2 ,1 ] * Ic * fitlrc_rec $ coef [ 1 ,1 ] ) * ( 1 / ( fitlrc_rec $ coef [ 2 ,1 ] *
Ic + fitlrc_rec $ coef [ 1 ,1 ] ) ) - fitlrc_rec $ coef [ 3 ,1 ]
} uniroot ( Ic , c ( 0 ,50 ) ) $ root Code # 根据饱和点定义,0.75最大光合速率为饱和点, # 也可以是其他比例 # 据此利用uniroot求解方程的根 Isat <- function ( Isat ) { ( fitlrc_rec $ coef [ 2 ,1 ] * Isat * fitlrc_rec $ coef [ 1 ,1 ] ) *
( 1 / ( fitlrc_rec $ coef [ 2 ,1 ] * Isat +
fitlrc_rec $ coef [ 1 ,1 ] ) ) - fitlrc_rec $ coef [ 3 ,1 ] -
0.75 * fitlrc_rec $ coef [ 1 ,1 ]
} # 求值区间根据具体实验确定 uniroot ( Isat , c ( 0 ,2500 ) ) $ root Code # 使用ggplot2进行作图并拟合曲线 library ( ggplot2 ) light <- data.frame ( lrc_Q = lrc $ PARi , lrc_A = lrc $ Photo ) rec_form <- y ~ ( alpha * x * Am ) * ( 1 / ( alpha * x + Am ) ) - Rd ggplot ( light , aes ( x = lrc_Q , y = lrc_A ) ) + geom_point ( shape = 16 , size = 3 , color = "green" ) +
geom_smooth ( method= "nls" , formula = rec_form , se = FALSE ,
method.args = list ( start = c (
Am = ( max ( lrc_A ) - min ( lrc_A ) ) ,
alpha = 0.05 ,
Rd = - min ( lrc_A ) ) ,
aes ( x = lrc_Q , y = lrc_A ,
color= 'blue' , size = 1.2 ) )
) +
labs ( y= expression ( paste ( "photosynthetic rate " ,
"(" , mu , mol %.% m ^ - 2 %.% s ^ - 1 , ")" ) ) ,
x= expression ( paste ( "PAR " ,
"(" , mu , mol %.% m ^ - 2 %.% s ^ - 1 , ")" ) )
) +
theme_light ( )
代码目的见注释,其实现过程主要分三步:
Table 8.1: 直角双曲线结果
Am
16.6721752
0.1522849
109.480151
0.0000000
alpha
0.0783312
0.0026774
29.256870
0.0000000
Rd
0.2810926
0.0789338
3.561117
0.0051716
最终的数据拟结果如 Figure 8.1 所示,拟合的参数及结果见 Table 8.1 。
Baly, EC. 1935. 《The kinetics of photosynthesis》 . Proceedings of the Royal Society of London Series B (Biological Sciences) , 期 117: 218–39.
Huang, HY, XY Dou, PY Sun, B Deng, GJ Wu, 和 CL Peng. 2009. 《Comparison of photosynthetic characteristics in two ecotypes of Jatropha curcas in summer》 . Acta Ecologica Sinica , 期 29: 2861–67.
Zhang, XS, SH Shen, 和 J Song. 2009. 《The vertical distribution of cotton leaf nitrogen content and photosynthetic characteristics in the North China Plain》 . Acta Ecologica Sinica , 期 29: 1893–98.
ZiPiao, YE. 2010. 《A review on modeling of responses of photosynthesis to light and CO_2 》 . Chinese Journal of Plant Ecology , 期 06.
