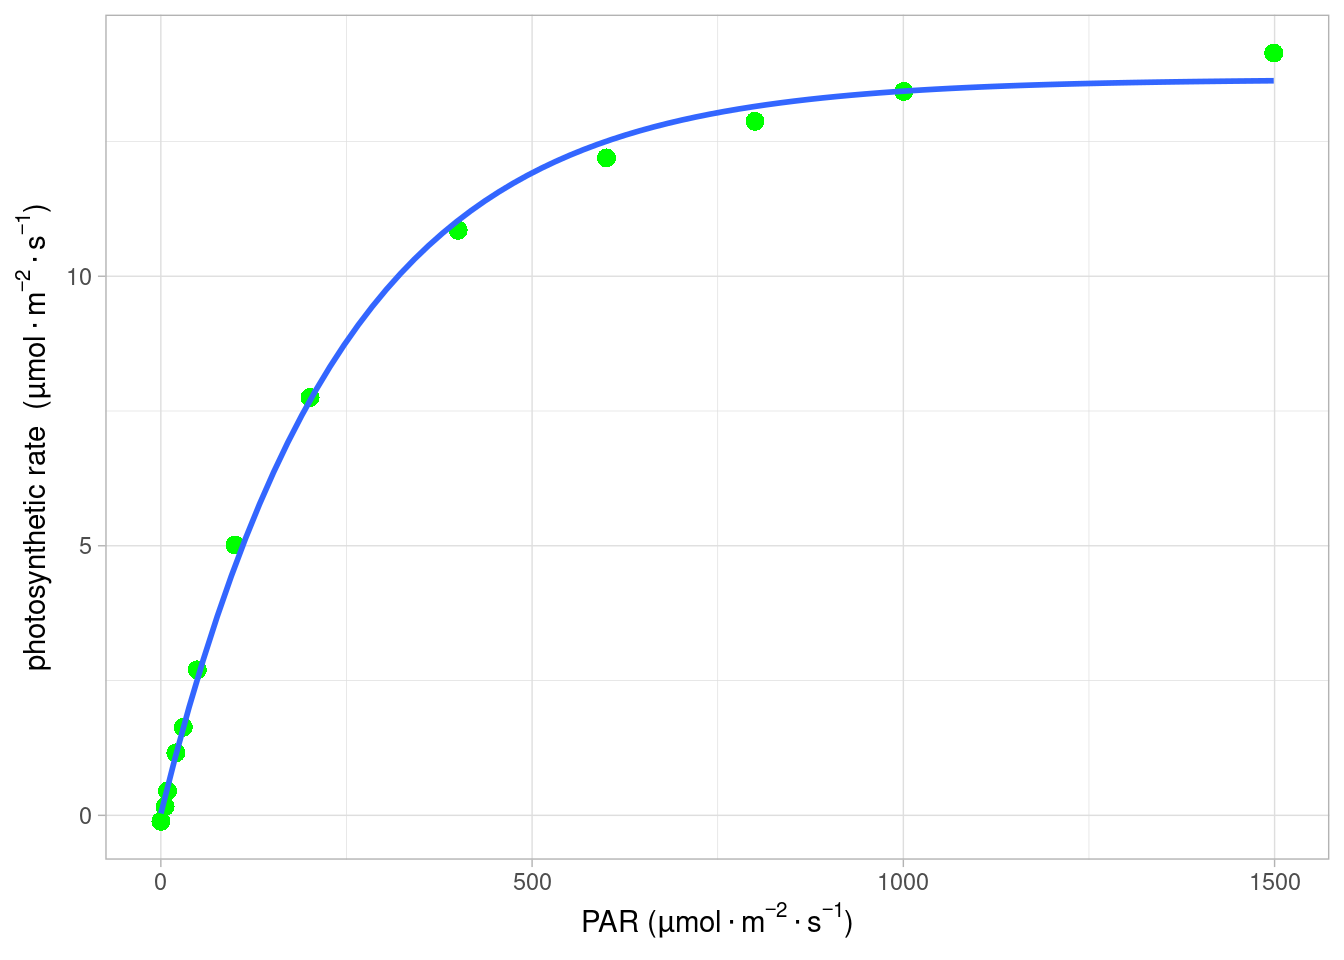
光合指数模型较多,我们此处使用的指数模型为 Prado 和 Moraes (1997 ) ,其表达式为:
P_{n} = P_{nmax}[1 - e^{-b(I-I_{C})}]
\tag{10.1}
其中,I_{c} 为光补偿点,e 为自然对数的底,b为常数,其他参数意义同 公式 10.1 。同样,该方程仍然是没有极值的函数,但我们可以直接求得光补偿点。
指数模型的实现
Code library ( minpack.lm ) # 读取数据,同fitaci数据格式 lrc <- read.csv ( "data/lrc.csv" ) lrc <- subset ( lrc , Obs > 0 ) # 光响应曲线没有太多参数, # 直接调出相应的光强和光合速率 # 方便后面调用 lrc_Q <- lrc $ PARi lrc_A <- lrc $ Photo # 模型的拟合 lrcnls <- nlsLM ( lrc_A ~ Am * ( 1 - exp ( ( - b ) * ( lrc_Q - Ic ) ) ) , start= list ( Am= ( max ( lrc_A ) - min ( lrc_A ) ) ,
Ic= 5 , b= 1 )
)
fitlrc_exp <- summary ( lrcnls ) # 光饱和点 Isat <- function ( Isat ) { fitlrc_exp $ coef [ 1 ,1 ] * ( 1 - exp ( ( - fitlrc_exp $ coef [ 3 ,1 ] ) * ( Isat -
fitlrc_exp $ coef [ 2 ,1 ] ) ) ) - 0.9 * fitlrc_exp $ coef [ 1 ,1 ] }
uniroot ( Isat , c ( 0 ,2000 ) ) $ root Code ## 拟合图形 library ( ggplot2 ) light <- data.frame ( lrc_Q = lrc $ PARi , lrc_A = lrc $ Photo ) exp_form <- y ~ Am * ( 1 - exp ( ( - b ) * ( x - Ic ) ) ) ggplot ( light , aes ( x = lrc_Q , y = lrc_A ) ) + geom_point ( shape = 16 , size = 3 , color = "green" ) +
geom_smooth ( method= "nls" , formula = exp_form ,
se = FALSE , method.args = list (
start = c ( Am= ( max ( lrc_A ) - min ( lrc_A ) ) ,
Ic= 5 , b= 0.002 ) , aes ( x = lrc_Q , y = lrc_A ,
color= 'blue' , size = 1.2 ) )
) +
labs ( y= expression ( paste ( "photosynthetic rate " ,
"(" , mu , mol %.% m ^ - 2 %.% s ^ - 1 , ")" ) ) ,
x= expression ( paste ( "PAR " ,
"(" , mu , mol %.% m ^ - 2 %.% s ^ - 1 , ")" ) ) ) +
theme_light ( )
Table 10.1: 指数模型计算参数
Am
13.6547568
0.1723363
79.233185
0.0000000
Ic
-0.5133438
2.3370250
-0.219657
0.8305573
b
0.0041183
0.0002012
20.467032
0.0000000
最终的数据拟结果如图 Figure 10.1 所示,拟合的参数及结果见表 Table 10.1 。
Prado, C. H., 和 J. A. P. V. De Moraes. 1997. 《Photosynthetic capacity and specific leaf mass in twenty woody species of Cerrado vegetation under field conditions》 . Photosynthetica 33 (1): 103–12.
