De Kauwe, Martin G, Yan Shih Lin, Ian J Wright, Belinda E Medlyn, Kristine Y Crous, David S Ellsworth, Vincent Maire, I Colin Prentice, Owen K Atkin, 和 Alistair Rogers. 2016. 《A test of the one point method for estimating maximum carboxlation capacity from field measured, light saturated photosynthesis》. New Phytologist 210 (3): 1130.
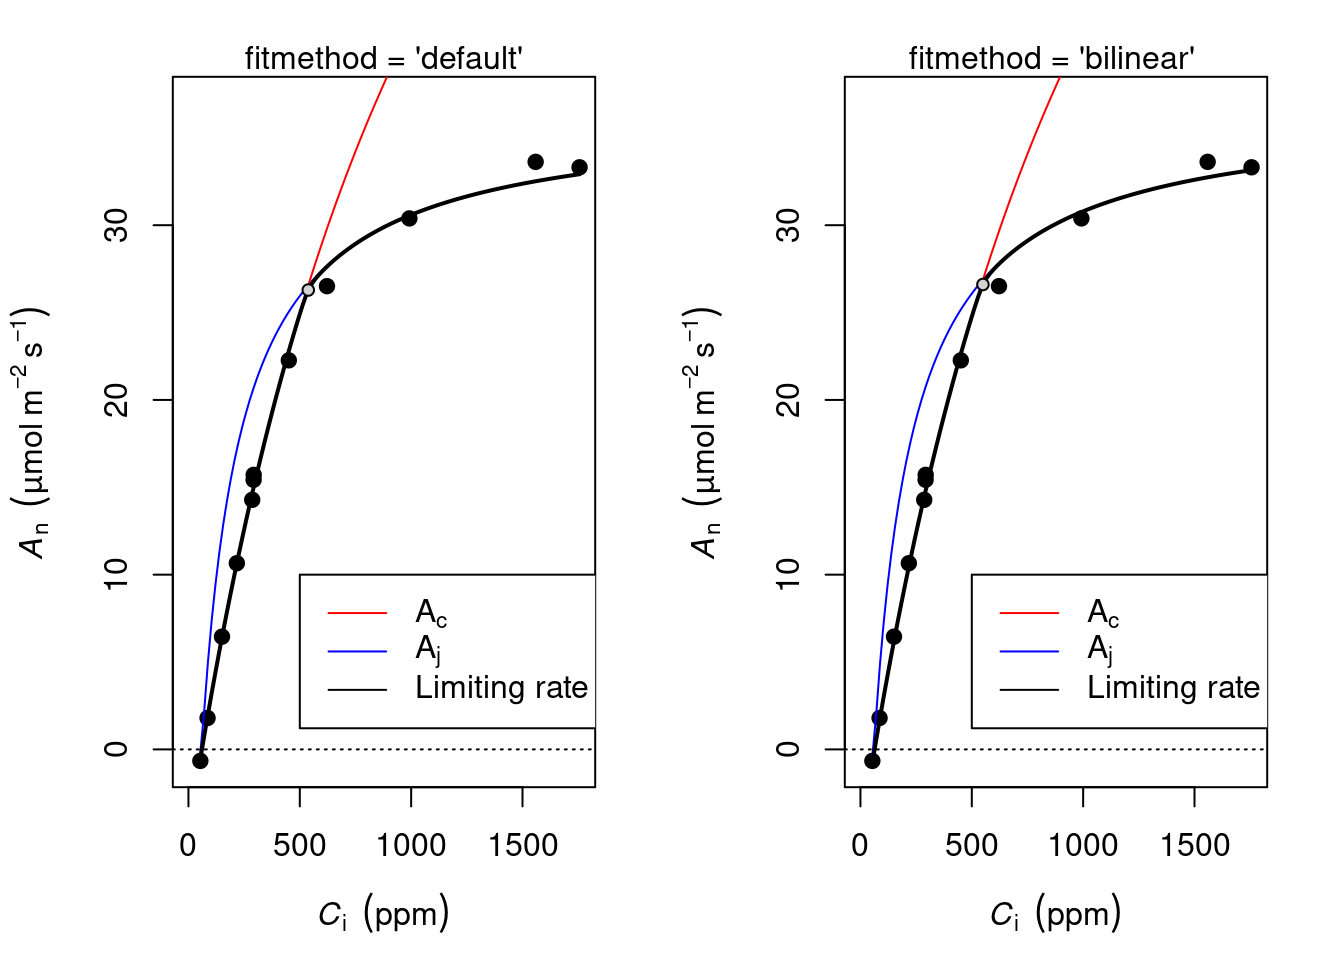
Duursma, Remko A. 2015. 《Plantecophys-An R Package for Analysing and Modelling Leaf Gas Exchange Data》. Plos One 10 (11): e0143346.
Farquhar, G. D., S. Von Caemmerer, 和 J. A. Berry. 1980. 《A biochemical model of photosynthetic CO_2 assimilation in leaves of C3 species.》 Planta 149 (1): 78–90.
Gu, Lianhong, Stephen G Pallardy, Kevin Tu, Beverly E Law, 和 Stan D Wullschleger. 2010. 《Reliable estimation of biochemical parameters from C-3 leaf photosynthesis-intercellular carbon dioxide response curves》. Plant Cell & Environment 33 (11): 1852–74.